Eyes to AIs: tech has changed how we interpret the colour of ice
The Greenland Ice Sheet has a dark stripe that was noticed by explorers and is now being explored from satellites, with help from AI.

(This is an expanded and polished transcript of a talk I gave for the NASA NOW lecture series in May 2025)
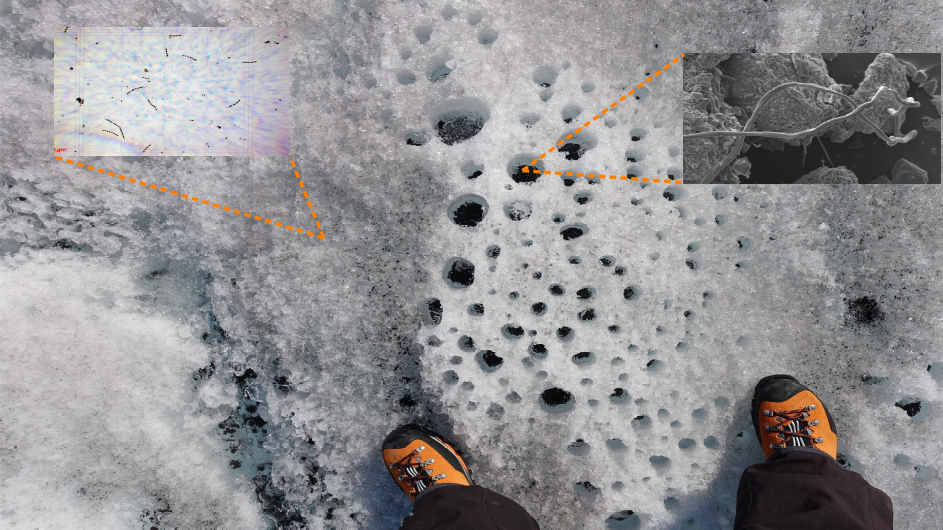
A century and a half ago, in summer 1870, explorer Adolf Nordenskiold was on the ice sheet on the western coast of Greenland. He noticed that the ice wasn’t white or blue, it had a dark grey discolouration,and he complained a lot in his diary about the difficulty he had walking and finding solid ice to sleep on because of the high frequency of bucket-like holes in the ice surface with a black sediment on their floors, which he called "cryoconite" - for cold dust. He examined the sediment and discovered it was bound together by biological material, including filamentous algae. There were so many of these that he frequently tripped into them and got a sodden sleeping bag because he couldn't find spaces between these holes large enough to lay himself down.
Nordenskiold was concerned about the albedo effect of this cosmic dust, where the darker ice more effectively absorbs solar energy and melts faster - he even suggested this grey space dust could be the "greatest enemy to the mass of ice" due to the melt acceleration.
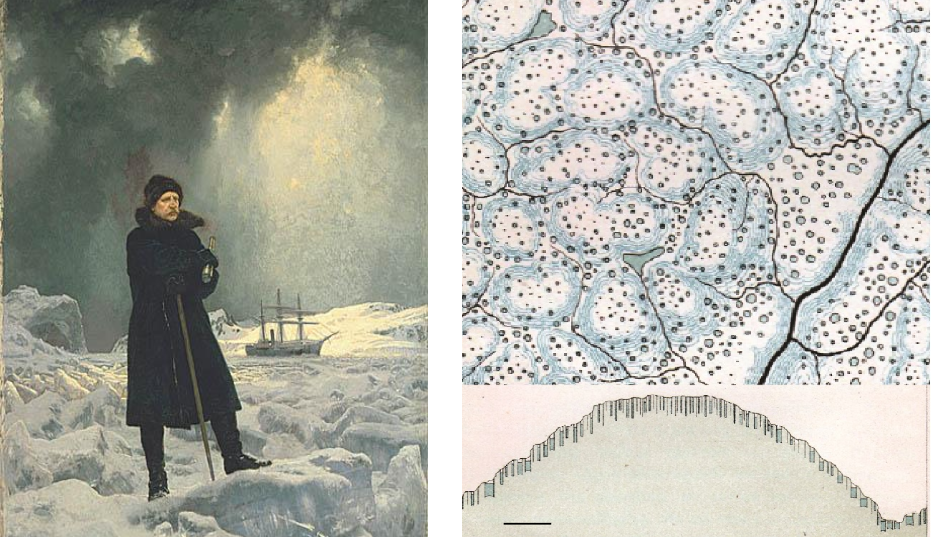
“from the fact that their dark colour far more readily absorbs the sun's heat than the bluish-white ice, and thereby they contribute to the destruction of the ice-sheet”
https://www.nature.com/articles/029039a0
Nordenskiold considers that this dust is of cosmic origin, and he believes that the earth is constantly receiving a reinforcement of matter in this shape from the surrounding universe.
Fridtjof Nansen, G. C. H. Journal of the American Geographical Society of New York, Vol. 23 (1891), pp. 171-193 (23 pages)
Fridtjof Nansen disagreed with Nordenskiold on the cosmic origin of cryoconite because, as he observed on an expedition to the Eastern coast of Greenland in 1891, the dust on the ice had similar composition to the surrounding deglaciated land, and its concentration decreased as he travelled inland from the ice margin, leading nansen to consider the dust to simply be dropped onto the ice by the wind . Nansen did observe the general ice darkness though, and he recognized early on that it was biological.
A hundred and twenty (ish) years pass by, and only a few papers mention cryoconite or dark ice on Greenland - there was Drygalksi (1908), Hobbs (1910) and Philip (1912) who commented on cryoconite hole shapes, and a little later Steinbock (1936) and Charlesworth (1957) studied cryoconite granules under the microscope. There was also some work in the 1980’s and 1990s on cryoconite hole formation and more characterisation of the microbes in the sediment (e.g. Wharton et al. 1980; Podgorny and Grenfell, 1996).
However, it was in the era of multispectral satellite remote sensing that new interest was sparked into this topic, which also coincided with increasing urgency in understanding ice sheet loss. With satellite remote sensing we can see Nordenskiold and Nansen's dark ice from space - they were only able to document what they saw with their eyes as they travelled on foot, whereas by the 2000’s we were able to observe the entire ice sheet using sensors looking back at Earth from space.
Now we can see why Nordenskiold was more concerned about the effect of the dark dusts than Nansen - on the Eastern coast Nansen was probably seeing local dusts on the edges of the ice, but Nordenskiold was seeing a keyhole view of something covering tens of thousands of square km on the fastest melting areas of the ice, where the ice sheet's contribution to sea level rise originates - a huge dark stripe on the western ice sheet.
There's been a lot of interest in mapping this dark stripe, determining its interannual variability and its likelihood to expand into the future, and to know that we have to know what processes are causing the discoloration and their relative importance.
What’s on the ice?
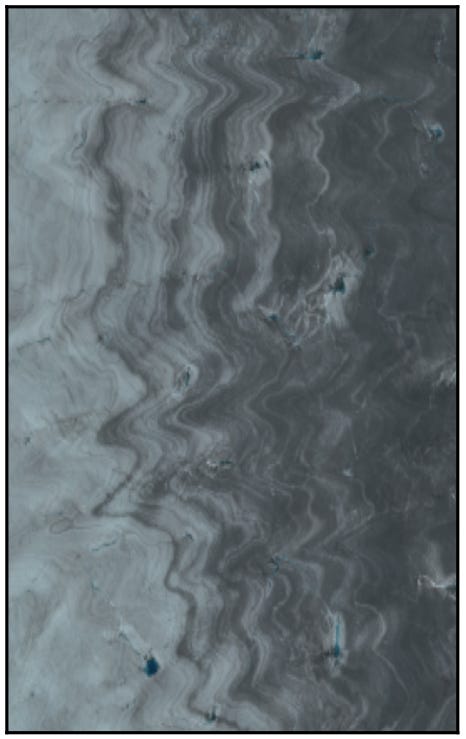
The first hypotheses about the darkening of the ice sheet focused on dust deposition - harking back to Nordenskiold, but this time not "cosmic dust" but dust that is deposited from long range transport by the wind and dust that is delivered from beneath. Dust that was deposited high on the ice sheet during the holocene, got incorporated into the ice and advected towards the margin, where it is now being exposed and expressed onto the surface as a light absorbing impurity.
This hypothesis is supported by the very geological "wavy" pattern that can be observed in the satellite imagery.
A little later, people realised (again) that there was a biological component to the dark ice, in the form of an algal bloom that formed directly on the ice surface. Field studies revealed this algae to be among the darkest particles on the ice surface, as it produces a photo-protective pigment that it uses to protect itself from being fried by the intense irradiance during the summer, which happens to be a dark, brownish colour that ends up being the colour of the ice surface because this algae is basically omnipresent in varying concentrations.
A series of field studies, including my own, used field spectrometry and lab experiments to show that in localised patches of very high concentration these algae can reduce the albedo relative to clean ice by around 20%. The same studies found that the dust component was very weakly absorbing, a somewhat surprising result that has now been replicated over and over - the mineralogy of the dusts found on the surface of the dark zone are all very weakly absorbing quartz and feldspar minerals that have a negligible direct impact on the ice albedo.
Getting off the ground
So on the back of these findings, there was a relatively intense period of trying to map these algae from drones and satellites. The first attempts to map the glacier algae used simple detection algorithms such as the famous "red-edge" and other band ratios and there were also experiments using the depth of the chlorophyll absorption feature at 680 nm wavelength - all of those methods have been proven to work well for other algae such as red snow algae (e.g. Painter et al 2001) and other photosynthesisers in other environments.
But these methods suffered in the context of glacier algae because the chlorophyll signature is often much more subtle for the algae than for other species because it's masked by the ancillary photoprotective pigments whose absorption overlaps with chlorophyll, making quantification from the chlorophyll feature uncertain. There was only a very small amount of actual field data available to use as ground truth for these models too. Quality field spectrometry data is costly to generate as it’s time intensive and sensitive to local conditions, meaning a field campaign might only generate 10 or so spectra per dedicated field scientist per day. pairing those spectra with sufficient metadata such as cell counts, ice physical measurements, dust concentrations, etc, adds up to a lot of person power and lab time.
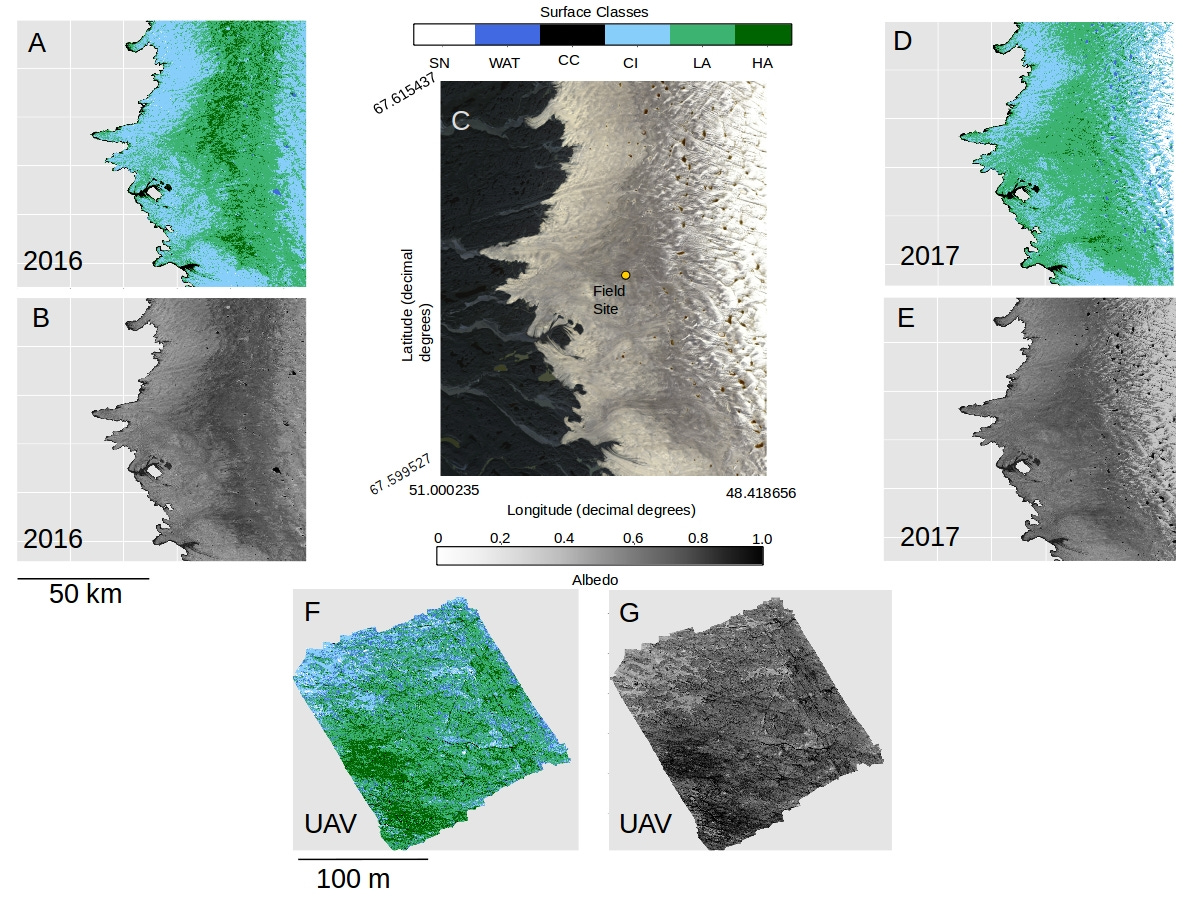
I also mapped an area in the SW ice sheet using a decision tree model that learned a set of field-measured spectra, reduced down to Sentinel-2 resolution, and used that to map algae - not fully quantifying it, but categorising the ice into L, M and H concentration classes and then using ground measurements to estimate the melt enhancement for each category, estimating up to a maximum of 13% of the runoff in that region was due to these algae. However, basing an algorithm like this on field spectra is imperfect as there's a limit on how many field spectra can practically be collected in a field campaign so the spectral library is smaller than one might ideally like, and field spectra are always mixed signals that are hard to unmix - which means the training data itself has a degree of uncertainty to it - there's a lack of "pure", fully explainable spectra for a model to learn.
So to progress we needed a new strategy that didn't start with the satellite data and try to mine insights, and was less reliant on small databases of field spectra. Instead we needed something more bottom-up and physical that attempted to meet the satellite data already having empirical information about the spectral signatures that we might expect to see.
Physical models
Radiative transfer modelling was our entry point here (this is a type of mathematical model that predicts how light interacts with materials) - at the time we didn't have field measurement or samples that we could use to get empirical optical properties for the glacier algae or the mineral dusts, but we did have information about the pigmentation of the cells, their size and shape, and the local mineralogy and PSD, so we set about generating synthetic OP data from that information and optical property datasets that already existed in the literature - we created a database of properties for algal cells and some mineral dusts and packaged that up into a python translation of mark Flanner's SNICAR model, which we called biosnicar. That was a big help because it allowed us to explore hypothetical scenarios and create synthetic "ground truth data", experiment with indirect albedo reducing effects where impurities alter the physical configuration of the ice, etc but we were also stuck with hypothetical optical properties for the most important impurities.
So I thought it was critical that we gather empirical optical properties for the glacier algae and mineral dusts, as that would give us confidence in our ability to model the surface and to make use of synthetic ground truth data for training models for interpreting multispectral data, and run experiments that would allow us to actually separate out signals from different darkening processes.
So that was where we were when the ERC project “Deep purple” started, and I had two PhD students who could work on this problem specifically. And the first thing we did was to measure the optical properties of glacier algae directly. This work was led by Lou Chevrollier, who published it in 2024. The algae were transported back from the field and living samples were put into cuvettes inside an integrating sphere and we directly measured their OPs and pushed the directly into biosnicar. Then we did the same for mineral dusts and we did this for samples from a range of sites around the ice sheet.
We also put a real lot of work into upgrading biosnicar so that it could use the most up to date RT solvers and included liquid water and other LAPs too and lots of accessibility improvements such as a web app and several refactors to make it developer and user friendly. We tested this by recreating the conditions found in the field and recreating our field spectra. We were able to reproduce near-perfect spectra using realistic config.
Turning models upside down
And then we turned our attention back to remote sensing, making use of our new empirically-informed modelling capabilities to generate large spectral libraries covering many, many permutations of ice physical properties, illumination conditions and concentrations of the various impurities. This gave us what we needed to start running the biosnicar model in reverse, where instead of giving the model a set of config and generating a spectrum, we give it spectra and it generates config - this is a way to algorithmically intepret the multispectral data we get from modern satellites.
What we found was that the spectra generated by the inverse modelling was always extremely closely matched to the field spectra and the retrieved config was realistic, so we set about to apply the model, in inverse mode, to multispectral satellite data. Now, we're able to go pixel-by-pixel and invert the spectra to yield estimates of the ice physical configuration and impurity concentrations in each pixel, yielding maps with layers for each parameter.
The next development was to train a neural network to do the forward and inverse modelling, so that you don't have to use a slow Python model with large (multi-GB) database of optical data - you can use a very lightweight, portable and language agnostic ML model instead with indistinguishable accuracy across the most useful subset of the total parameter space. Lou developed this emulator as a new project, spun off from biosnicar, called snowlaps.
As for the darkening effects of each parameter, the inversion model is run to get the most likely configuration of the surface based on the spectral signatures, then that config is sent to biosnicar (in forward mode) to systematically generate new spectra where each parameter is individually reset to a clean ice "reference value" - this yields an albedo delta for each parameter that we can map, compare and rank.
What can we see
While all the work was happening to constrain the optical properties and impacts and distribution of glacier algae and mineral dusts between 2010- to 2020-ish, cryoconite got forgotten again - which is crazy because it is one of the most strikingly obvious albedo reducers on the ice - jet black and so frequent poor Nordenskiold couldn't keep his feet out of it. Now, it’s in biosnicar and included in the latest mapping studies so its impact can be quantified relative to the other processes going on on the ice surface.
The latest results indicate that cryoconite could actually be the primary cause for the low albedo of Greenland's dark stripe, followed by the glacier algae - the development of the so-called weathering crust and mineral dusts play secondary roles. Interestingly, the new results suggest that the previous estimates of algal albedo reduction were about right, but they are exceeded by the effects of cryoconite. In a way, both Nordenskiold and Nansen are vindicated.
What's satisfying about this is that it feels like we've finally converged on an explanation where what we see from the multispectral data is consistent with what our eyes tell us on the ground inside the dark zone.
I think this hierarchy of processes makes a lot of sense, as it brings together a lot of loose ends from history - we have ablation releasing mineral fragments from the ancient ice, which in turn stimulates algal growth and the formation of cryoconite granules, both of which need the mineral fragments as a substrate and a source of nutrients. Although the minerals aren't directly reducing the albedo much, if at all, they are stimulating the growth of algae and the formation of cryoconite, giving the mineral dusts a critical indirect effect.
This explains why there's a very geological pattern observed in the imagery, even though the mineral dusts themselves have repeatedly been shown to be weakly absorbing.
What does it mean for the future? That I don't know, but my personal hunch is that it might imply the potential for dark zone expansion for a while, until we hit a physical limit imposed by the high elevation limit of where holocene dusts are exposed at the surface - so a possible glaciological control on dark stripe expansion.